By Yang · 全職奶爸 · Order flow and price action
Order flow trading studies how orders and completed trades interact with price. A footprint shows volume inside a candle; a DOM shows displayed orders waiting at prices; Time & Sales lists executions. Together, these views help you examine what happened when price reached a level you were already watching.
Suppose a market reaches support. Selling continues, but price barely moves lower. That reaction deserves a closer look. If selling keeps pushing price through support instead, you have a different situation, even if both screens contain plenty of red numbers.
The useful question is how price responds to the activity. More information can help you describe that response, but a positive Delta, a thick bid or an impressive footprint does not complete an entry plan. You still need a location, a confirmation condition and a point where the idea fails.
Choose the view for the question you need answered
A candlestick records the open, high, low and close for its interval. Add ordinary volume and you know how much activity the feed recorded during that interval. You still lack the distribution across prices, the sequence of executions and the displayed orders that were waiting between those executions.
Order flow tools organize those details in different ways. Start with one question. To inspect where transactions accumulated within a particular bar, choose a footprint. To observe displayed liquidity before an execution, use the book. To read transactions in sequence, examine the tape.
| View | Information shown | What to examine |
|---|---|---|
| DOM / order book | Displayed resting quantity at prices | How visible liquidity changes as price approaches |
| Time & Sales | Recorded trade times, prices and sizes | Execution sequence and pace |
| Footprint | Volume grouped by price within a bar | Concentration and classification of activity |
| Volume Profile | Volume by price across a chosen range | Where the range accumulated activity |
| Cumulative Delta | Accumulated classified volume difference | How that difference develops from its reset point |
A heatmap adds a time dimension to displayed depth. Trade bubbles can overlay executed volume on that history. Read the legend: a bright band representing resting size and a large bubble representing a completed trade describe different events. A band becoming brighter by itself does not establish an execution.
VWAP adds another useful reference by averaging traded prices with volume weights. It can help locate price relative to activity over its chosen period, while leaving questions about current queue size to the book. Your existing chart can supply context without requiring every available order flow indicator.
For range selection and POC, VAH and VAL settings, use the Volume Profile guide. A whole-session profile and a single candle's footprint may highlight different prices because their calculation ranges differ.
Read the totals before interpreting the colors
Each trade has a buyer and a seller. When a display labels volume as buying or selling, the label refers to its classification method. On an aggressor-based feed, ask-side executions can indicate buyers taking offered liquidity, while bid-side executions can indicate sellers hitting bids. Other tools estimate categories from price movement.
Check that method before calling a colored number aggressive buying. Then identify the price column, the volume columns and their units. A value marked K represents thousands; a row may combine several ticks. Comparing one ungrouped price with another platform's five-tick row can produce a difference without either calculation being broken.
In the constructed example below, the left column is sell-classified volume and the right column is buy-classified volume. The prices are fictional and the quantities are illustrative contracts. The diagram is a reading exercise, rather than an exchange record or a platform screenshot.
At 100.00, the two columns contain 20 and 50 contracts, totaling 70. That is the largest row total, so 100.00 is this example bar's point of control, or POC. The other rows total 50 at 100.25 and 40 at 100.50. Across all three rows, total volume is 160.
Buy-classified volume totals 90 and sell-classified volume totals 70. Delta is 90 minus 70, or +20. Its percentage of total volume is 20 divided by 160, or 12.5%. These figures summarize classification. They say nothing about an individual participant's remaining position.
POC identifies the row with the most volume within the selected bar. Whether that area later acts as support depends on subsequent trading. Price may rotate around it, leave it and return, or move through it. Keep that distinction when drawing a horizontal level from a footprint.
Imbalance is a separate comparison. Some footprints compare buy volume at one price with sell volume one level below, rather than comparing the two numbers on the same row. For example, 60 against 20 is a three-to-one ratio. Read the platform's diagonal direction, threshold and zero-volume treatment before interpreting its highlights.
A stacked imbalance means consecutive levels satisfy the selected comparison on the same side. Increasing the threshold changes which rows qualify. It does not establish a higher win rate, and it does not change the underlying trades simply because fewer colored marks remain.
Two similar candles can contain opposite Delta
Imagine two bars both open at 100.00, reach 100.50, trade down to 100.00 and close at 100.25. Both record total volume of 160. Their candlestick shapes and total-volume columns can look identical.
Give the first bar the quantities in the diagram: buying 90, selling 70 and Delta +20. For the second bar, swap the two classifications at every row. Buying becomes 70, selling becomes 90 and Delta becomes −20. Row totals and the POC stay the same.
Both sets can coexist with those open, high, low and close values. OHLC and total volume alone do not uniquely specify the classified volume inside the bar. The exercise also works in reverse: knowing Delta does not uniquely determine the sequence of prices or the next candle.
This is why a green candle with negative Delta need not be a data error. Price direction compares the close with the open. Delta compares two volume categories. Read both definitions before looking for a story about trapped traders.
Cumulative volume delta, often called CVD, adds successive Delta values from a selected starting or reset point. A daily reset and a multi-session accumulation can have different levels on otherwise similar charts. Compare the change over the same interval and confirm the reset rule before interpreting divergence.
A rising price with weakening CVD can justify closer observation, but it remains a disagreement between measurements. A trend can continue through several divergences. Decide what subsequent price behavior would validate the observation before using it in a trading rule.
A smaller order-book number does not tell you what happened
Suppose a bid displays 100 contracts and later displays 60. It is tempting to describe the missing 40 as sellers executing against that bid. A pair of snapshots gives you too little information to make that conclusion.
Forty contracts could have executed, leaving 60. Alternatively, 40 could have been canceled with no executions. Or 20 could have been added while 10 executed and 50 were canceled. All three paths end at the same displayed quantity.
The accounting in the last case is 100 + 20 − 10 − 50 = 60. To distinguish the paths, you need the appropriate event stream and execution records. A screenshot taken before and after the change preserves the endpoints while losing the activity between them.
Even a detailed book has a defined scope. CME's Market by Order explanation describes anonymous individual orders and the distinction from price-level aggregates. Order-level information adds detail without identifying the customer behind an order.
Displayed quantity can also differ from a larger order's undisplayed balance. Iceberg behavior is therefore a reason to examine the feed and event history carefully. An iceberg order is not inherently evidence of manipulation, and a cancellation alone does not prove spoofing intent.
Your account records form another category. A public trade at your limit price does not establish that your order filled. Queue priority, quantity and the matching process affect execution. If you use Tradovate, the Tradovate DOM guide covers ladder settings, working orders and the scope of its Close control.
Look for price progress when studying absorption and exhaustion
Absorption is an interpretation of substantial aggressive activity meeting enough opposing liquidity that price makes limited progress. At support, you might observe repeated selling into the bid without sustained movement lower. At resistance, repeated buying can meet offers while price struggles to advance.
The next response matters. Suppose selling repeatedly reaches a marked support area, then price recovers the area's upper boundary and a later retest holds. That sequence gives you more to work with than the large sell quantity alone. If price instead establishes trading below the area and keeps moving lower, the proposed support has failed.
Exhaustion describes a different observation: participation on the attacking side diminishes near an extreme. Compare it with similar activity in the same market and session. A quiet time of day should not automatically become an exhaustion signal just because its volume is smaller than the opening rush.
A failed auction describes an attempt to establish prices beyond an area that does not sustain participation and returns. It can overlap with an exhaustion or absorption interpretation, depending on the data. Keep the observed sequence separate from the label, especially when reviewing examples afterward.
Some footprint approaches inspect minimal volume at an extreme or call continued two-sided activity an unfinished auction. Treat those conditions as features to test. A zero or a nonzero cell does not oblige the market to revisit a price.
Large trade markers can help locate activity worth studying, but size alone reveals little about purpose. An execution could open exposure, close it, hedge another market or form one part of a larger operation. Public size does not supply a participant's intent or a complete portfolio.
Put order flow into a setup with a clear failure point
Choose the trading location before watching the small numbers. If you use Smart Money Concepts, your existing structure, liquidity and zone definitions can supply that location. Order flow then adds observations about activity when price reaches it.
For a constructed breakout-retest study, mark a range boundary using a fixed rule. Define what counts as a completed breakout, when a retest is eligible and which price action confirms continuation. Write those conditions before reviewing the footprint.
You might add a requirement that the retest shows selling with limited downward progress followed by a recovery above the boundary. Define the observation interval and comparison quantity precisely enough that another review of the same data produces the same decision. A vague instruction to look for strong buying is hard to test consistently.
Next, define invalidation. In this study, acceptance back inside the range can cancel the continuation idea. Specify what acceptance means in your model, such as a completed close and a subsequent failed recovery. A different model can use another rule; the important part is to decide before the outcome appears.
Keep the original structural stop and the account's permitted risk in view. An attractive footprint does not widen a firm's loss limit or remove slippage. Where a chart stop requires more risk than the account allows, the setup does not fit that position size.
For a rejection study, reverse the question. Observe activity beyond a boundary, wait for price to return and then assess whether a retest supports the return. A sustained breakout is the competing outcome. Store both outcomes so the label is not assigned only to examples that later reverse.
News can change liquidity and execution conditions during either model. Record the event context in your tests, including sessions when spreads widen or fills become worse. A chart-based confirmation rule still needs realistic execution assumptions.
Know what TradingView's footprint calculates
TradingView provides a native Volume footprint chart type. Its official footprint guide explains that buy and sell categories are assigned using intrabar price direction. Historical calculations can use progressively coarser intervals as finer data becomes unavailable.
That method differs from labeling every transaction using an exchange aggressor flag. Compare charts only after checking the symbol, interval, session and classification method. A familiar red-and-green layout does not establish identical input data.
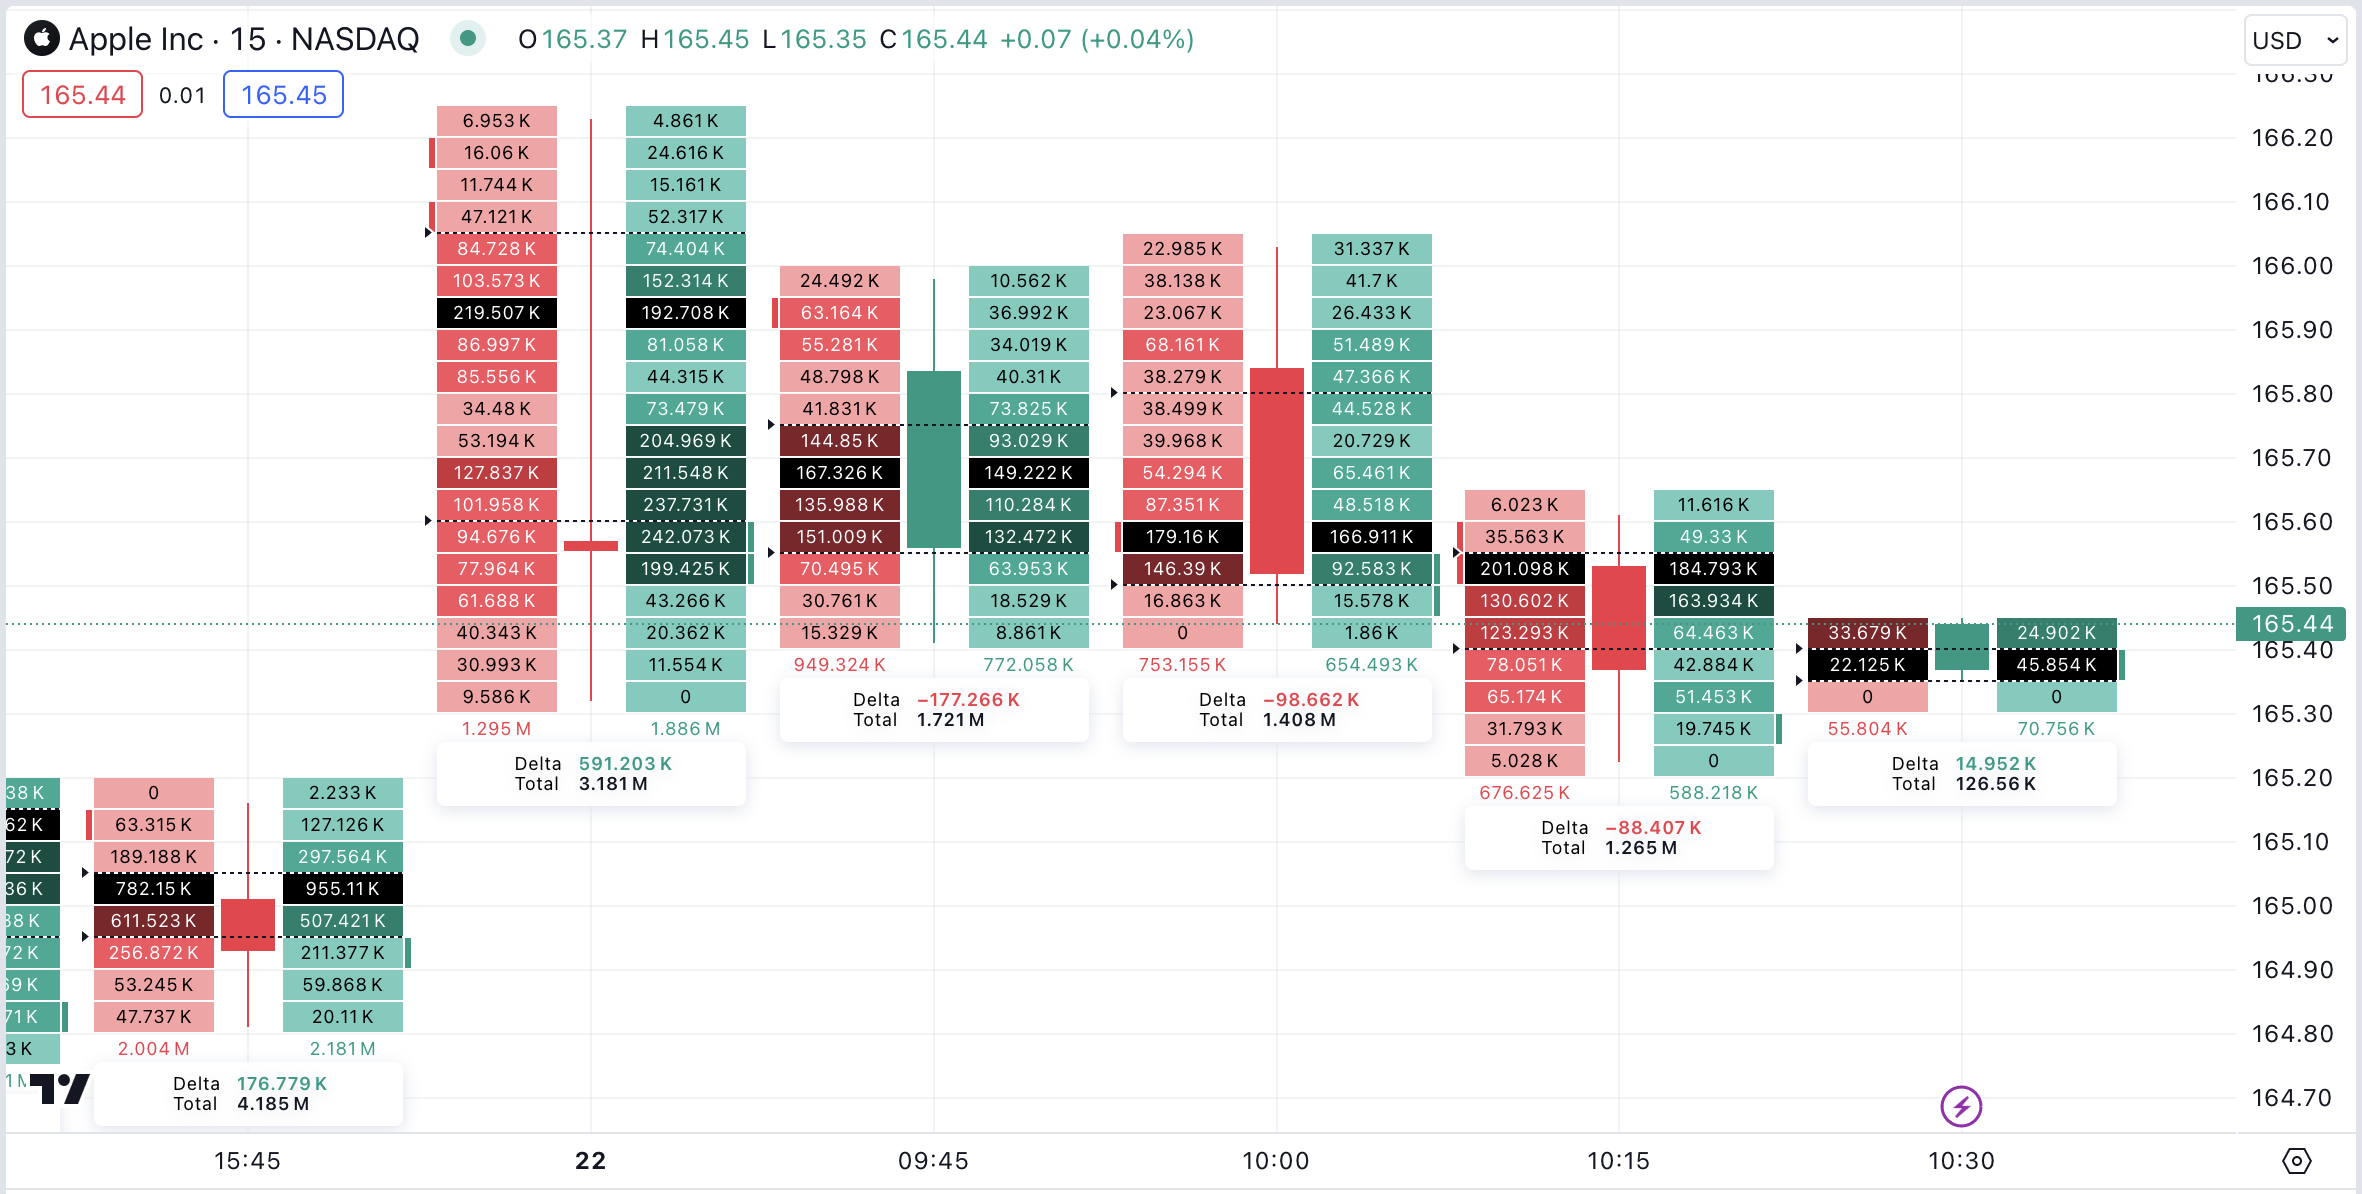
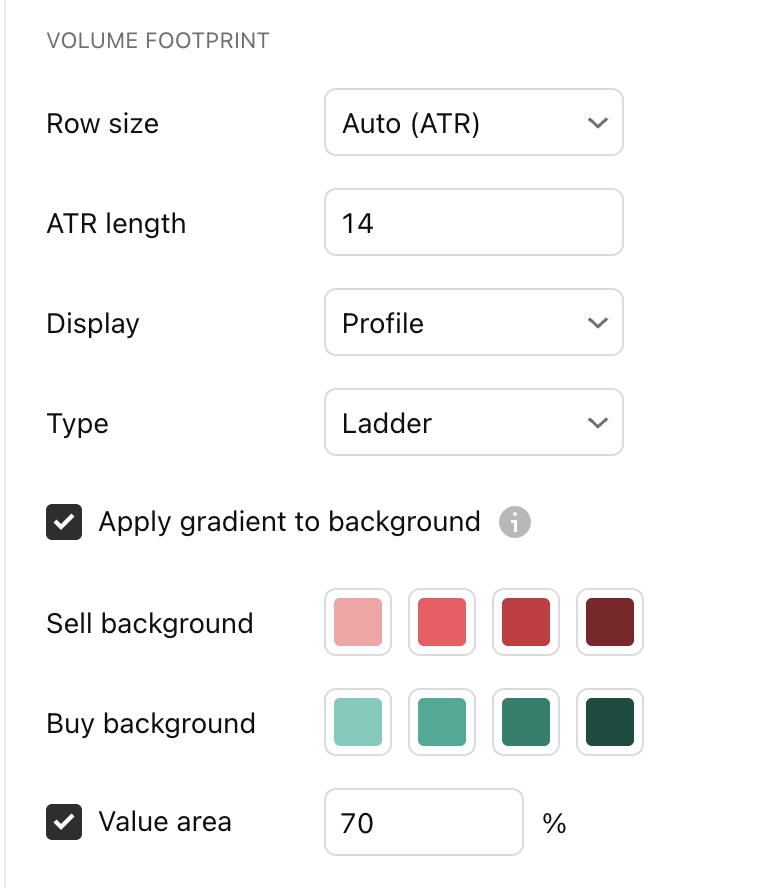
Use the chart-type selector to choose Volume footprint, then open chart settings. Type controls the representation; Buy and Sell displays the two categories on opposite sides. Row size controls price grouping. For a reproducible comparison, record the manual ticks per row instead of relying only on a layout that can change its grouping.
Zoom until the figures are legible, then work through one bar before interpreting a full screen. Keep a contemporaneous screenshot when documenting a signal: historical recalculation and row grouping can change how later review looks.
A footprint alert reports that its configured condition was met. Whether it is useful for an entry depends on your tested model. Feature access and data entitlements also need checking for your own subscription and symbol.
Check the market, contract and feed before comparing software
For futures, choose the exact contract and expiry you are studying. A continuous chart is useful for a longer view, but a rollover can combine periods associated with different contracts. Align the dated contract when comparing an execution feed with a footprint.
A futures contract's centralized exchange book still describes that contract. NQ and MNQ are related instruments with separate order books. Activity in one can provide context for the other, while its displayed depth and exact fills remain separate.
Cryptocurrency data also belongs to a venue and product. Spot trading on one exchange and perpetual futures on another can show different quantities and Delta. Combine or compare them only after establishing what each feed includes.
For spot FX and CFDs, read the provider's volume definition. Tick volume can count quote changes rather than transacted units. A broker-specific display does not become a consolidated global foreign-exchange tape.
When choosing software, check the actual input needed: executions for trade-based analysis, appropriate depth for a book view, and suitable historical data for replay. Then check platform access, data fees, supported connections and readable display sizes. A software subscription and an exchange data entitlement are separate items.
If you use a supported Rithmic connection, the Quantower and Rithmic setup guide addresses connection modes and missing-data symptoms. A successful login is only one check; the selected symbol and the available data still need to match your study.
Practice with a comparison that can show you were wrong
Select one market, one session and one entry model. Keep a record of location, data source, row grouping, the observation made before entry and the later price response. Preserve the screenshot taken at decision time alongside any later replay.
Compare the same base setup with and without the extra order flow filter. Include eligible setups that the filter rejected, not just trades it approved. Otherwise, the record can hide good opportunities that the extra condition removed.
Include commissions, spread and realistic slippage in the comparison. A small improvement in entry price may matter less than additional costs or missed fills. Simulation helps you learn the display, while its fills and emotional conditions can differ from live execution.
Make one change at a time. If you alter the session, timeframe, threshold and entry condition together, the result gives you little evidence about which change helped. Keep a separate period for checking rules you developed on earlier examples.
On a narrow screen, inspect a small number of bars at a readable scale. Phone screenshots are useful records, but shrinking a full desktop ladder onto a phone can make prices and quantities hard to distinguish. The useful display is the one whose labels you can actually read at the moment of a decision.
Order flow trading FAQ
What is order flow trading?
It studies orders and completed trades alongside price. Common views include the DOM, Time & Sales, footprints and Delta. Each view has a specific data source and scope.
Is order flow better than candlesticks?
It adds information about activity inside and around candles. Whether that helps your strategy requires a fair comparison using the same setups, costs and execution assumptions.
Does positive Delta mean price will rise?
Positive Delta means buy-classified volume exceeds sell-classified volume for the chosen interval. Price can still fall or stall if the activity fails to produce upward progress.
Why can a green candle have negative Delta?
Candle color compares open and close. Delta compares classified volume. Those measurements can disagree without a calculation error.
Is footprint volume the same as DOM depth?
A footprint groups recorded volume. DOM depth shows displayed resting orders, which can change or be canceled before execution.
Does the POC always become support or resistance?
POC marks the highest-volume row in the selected range. Its later role depends on subsequent price response and the range used.
What does cumulative Delta add?
It accumulates successive Delta values from a defined reset point. Match the session and reset rule before comparing two CVD displays.
What is absorption in order flow?
It describes substantial aggressive activity meeting opposing liquidity with limited price progress. A later continuation through the area can invalidate the proposed support or resistance interpretation.
Can order flow identify institutional traders?
Public quantities do not directly identify customers or their full positions. CME's MBO feed remains anonymous even when individual order records are available.
Is an iceberg order automatically manipulation?
No. An iceberg concerns displayed versus undisplayed quantity. A claim of manipulation requires more than recognizing replenishment or seeing an order canceled.
Can I use order flow on TradingView?
TradingView has a native Volume footprint chart type. Its classification uses intrabar price direction, so check the calculation method before comparing it with an aggressor-based execution feed.
Why do two platforms show different footprints?
Compare the exact contract, venue, session, data source, classification, bar interval and row size. Historical data granularity can also change the result.
Do I need Level 2 for every order flow tool?
Book-depth views need suitable depth data. A trade-based footprint has different input requirements. Check the specific tool and feed instead of assuming one entitlement supplies every view.
Can I learn in simulation?
Simulation can help with reading data and following defined rules. Its execution assumptions, costs and trading conditions need separate evaluation before treating its results as evidence for live trading.

Compare HDP discounts
Lucid 30% · Tradeify 30% · TPT 50%.
See current offers ↗Eligible partner plans only.