TRADINGVIEW · MOM FORMULA AND ROLLING PRICE COMPARISONS
The Momentum indicator, or MOM, compares the current price with the price a fixed number of bars earlier. TradingView’s built-in version subtracts the earlier Source value from the current one. With Length 10 and Source Close, it measures the close-to-close price difference across ten bars. Its baseline is zero.
That sounds simple until price falls while the Momentum line rises. The comparison price moves forward every bar too. A zero crossing can therefore occur even when the latest candle closes lower than the preceding candle. Reading both endpoints explains more than memorizing a buy or sell label.
Separate the MOM study from the wider momentum family
“Momentum indicators” can mean a family of tools including RSI, MACD, and Stochastic. A search for “Momentum” can also produce custom scripts, squeeze indicators, and trading strategies. Those names do not establish that the tools use the same calculation.
This guide follows the built-in TradingView study named Momentum, displayed on the chart as Mom. It is a difference oscillator with a configurable Length and Source. Its calculation contains no volume input, averaging period, or built-in order rule.
The broader idea of momentum trading means looking for continuation in an existing move. That is a trading approach. MOM is one measurement that a trader might investigate within such an approach. Selecting the indicator does not supply the rest of the method, and a rising oscillator alone does not identify which market has the best future return.
Calculate MOM from two dated Source values
Let N be Length, S(t) the current Source value, and S(t−N) the Source value N bars earlier:
MOM(N) = S(t) − S(t−N)
With Source Close, a current close of 110 and a close of 100 ten bars earlier produce MOM 10 = +10. The output uses the instrument’s price units. If its chart is quoted in index points, the result is points; it is not automatically a percentage or a profit amount.
A positive value means the current Source is higher than its selected earlier value. A negative value means it is lower. Zero means those two values match. None of these statements requires the latest one-bar price change to have the same sign.
Length counts gaps between observations. Calculating a three-bar difference requires the current value and the value three bars earlier: four dated observations including both endpoints. Ten bars on a fifteen-minute chart and ten bars on a daily chart describe different samples.
A falling close can lift MOM through zero
Use this hypothetical sequence with Length 3 and Source Close. The short length keeps both comparison pairs visible; it is an arithmetic illustration, not a recommended trading setting.
| Observation | Close | Close 3 bars earlier | MOM 3 |
|---|---|---|---|
| 0 | 110 | Not yet available | Not calculated |
| 1 | 100 | Not yet available | Not calculated |
| 2 | 105 | Not yet available | Not calculated |
| 3 | 109 | 110 | −1 |
| 4 | 108 | 100 | +8 |
At observation 3, the calculation is 109 − 110 = −1. At observation 4, it is 108 − 100 = +8. The latest close fell by one point, from 109 to 108, while the reference fell by ten points, from 110 to 100.
The Momentum line rose by nine points because −1 − (−10) = +9. It also crossed zero. Calling that crossing proof that the latest candle rose would misread the calculation. The current close is above the newly selected reference, even though it is below the immediately preceding close.
This example also explains a sudden turn when an unusually high or low reference leaves the comparison. Look back N bars before treating the oscillator’s jump as fresh acceleration at the current price.
Read the line’s sign and slope as separate observations
A value of +20 falling toward +5 says the current price remains above its N-bar reference, while the gap has narrowed. A value of −20 rising toward −5 says the current price remains below its reference, while that negative gap has narrowed. Neither description by itself specifies the latest candle’s direction.
The exact relationship is useful when a move looks puzzling:
Change in MOM = latest one-bar Source change − one-bar change at the reference endpoint.
If the current endpoint rises by two points and the earlier endpoint rises by five, MOM falls by three. If the current endpoint falls by one and the earlier endpoint falls by ten, MOM rises by nine. Both endpoints move through the price series as time advances.
For positive prices, a sustained rising price sequence keeps a fixed-length difference positive once both endpoints lie within that sequence. A positive reading does not establish that every intervening bar rose, that the market is above resistance, or that the next bar will continue.
The same endpoints can hide very different paths
Consider two six-observation paths. One rises steadily: 100, 102, 104, 106, 108, 110. The other moves through 100, 115, 95, 120, 98, 110. At the final observation, MOM 5 equals +10 for both.
The second path contains larger reversals and a much wider range. Its final five-bar difference still uses only 110 and 100. The indicator does not retain a separate description of the route between those values.
This is why two equal readings need not offer equal trading conditions. Inspect intervening swings, gaps, spreads, and the location of your proposed stop on the price chart. A smooth-looking endpoint difference is not a measure of the maximum adverse move a position experienced inside that window.
Add the built-in Momentum indicator on TradingView
Open a chart, choose Indicators, metrics, and strategies, and enter Momentum in Search. Under Technicals, choose the result named Momentum. The menu also contains Momentum strategy and several other oscillators; select the exact study name shown below.
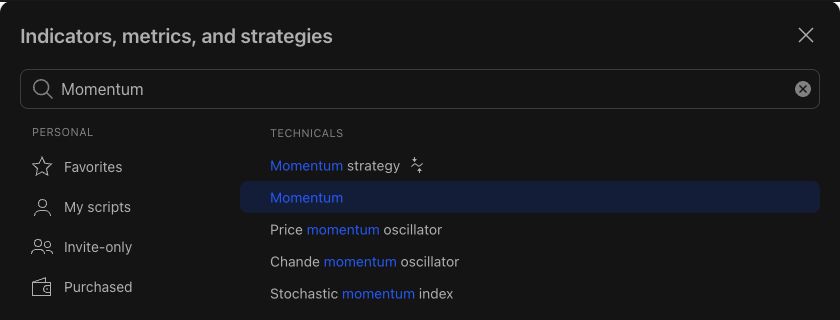
After adding it, the legend shows Mom 10 close with the current value. Double-click the Mom label to open settings. In Inputs, begin by checking Length = 10, Source = Close, and Timeframe = Chart.
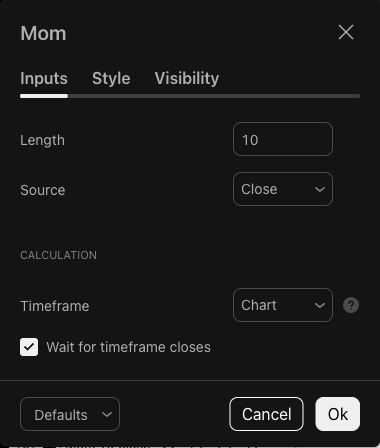
The current built-in source uses src − src[len]. Its settings contain no additional smoothing-length field. Choosing a different Source changes both the current and earlier inputs; the close-to-close explanation then needs the corresponding adjustment.
Use Style for line appearance and Visibility for the chart intervals on which the study appears. The TradingView indicators guide covers selecting studies and managing their display. The platform’s Momentum help page provides the broader momentum-trading context.
Choose Length to define a question you can test
Length 10 is the built-in default, not a demonstrated optimum. A shorter length compares closer observations and changes which prices drive the result. A longer length looks farther back. Neither choice supplies a known winning percentage.
On uninterrupted fifteen-minute bars, Length 10 spans 150 minutes between closing timestamps. A trading break can make the elapsed clock time longer. Ten daily bars refer to ten available daily intervals, rather than ten calendar days.
Before changing Length, write the question: are you studying an opening move, a session trend, or a multi-session swing? Keep the instrument, session, and confirmation rule fixed while comparing lengths. Review quiet ranges and failed moves as well as the chart segment that first made a setting look attractive.
If you test 5, 10, and 20, treat them as three candidate rules with their own results. Selecting a winner after seeing the complete history and reporting that same history as an independent test would overstate the evidence.
Match calculation timeframe, endpoints, and confirmation
Timeframe = Chart uses the current chart interval. A different calculation timeframe uses a different series of observations. The Wait for timeframe closes checkbox matters when the study is calculated from a higher timeframe: confirmed readings become available after the selected period closes.
Distinguish the chart candle’s close from the calculation candle’s close. A one-minute bar can finish while the fifteen-minute calculation bar is still developing. A connected line between higher-timeframe readings does not create new independent confirmed observations.
For a Close-based difference, matching actual endpoints can reconcile calculations across intervals. A five-bar one-minute difference and a one-bar five-minute difference both equal 110 − 100 if their selected closing timestamps match. Changing Length 1 from one-minute to five-minute bars generally changes the elapsed comparison instead.
Other Source choices can complicate that match. A price derived from a candle’s high, low, and close can change when trades are regrouped into larger candles. Align timestamps and Source definitions before comparing two panels.
MOM, percent ROC, and a 100-based ratio use different scales
Some platforms display a study named Momentum around 100. For example, the MetaTrader 5 Momentum calculation divides the current close by the earlier close and multiplies by 100. That is a ratio, whereas TradingView’s MOM is a subtraction.
Percent Rate of Change divides the difference by the earlier price and multiplies by 100. For a nonzero earlier price, the 100-based ratio equals percent ROC plus 100. Compare the same endpoints:
| Earlier → current | MOM difference | Percent ROC | 100-based ratio |
|---|---|---|---|
| 100 → 110 | +10 price units | +10% | 110 |
| 1,000 → 1,010 | +10 price units | +1% | 101 |
| 100 → 90 | −10 price units | −10% | 90 |
| 100 → 100 | 0 | 0% | 100 |
The first two rows have identical point differences but different relative changes. A universal threshold such as MOM +10 therefore has different meaning across price scales. Percent normalization answers another question; it does not establish that two markets have identical volatility or trading risk.
For a positive earlier price, difference and percent ROC have matching signs. An earlier price of zero makes the ratio undefined. A negative denominator changes the ordinary return interpretation: a move from −10 to −5 is a positive difference of +5 but produces a negative percent calculation. Check those conditions before applying a zero-versus-100 rule to unusual price histories.
A moving-average slope can repeat the same information
Let SMA(N) be the simple average of the latest N Source values. Subtract its value one bar earlier. All shared values cancel, leaving the newest Source minus the value that dropped out, divided by N:
MOM(N) = N × [SMA(N) now − SMA(N) one bar earlier].
In the three-bar example, SMA 3 at observation 3 is about 104.667. At observation 4 it is about 107.333. The increase is about 2.667; multiplying by three gives MOM 3 = +8.
This relationship uses a three-value average and a three-bar price difference. Adding one to the multiplier would be an indexing error. A positive MOM and a rising matching SMA describe the same algebraic condition, so counting them as two independent confirmations would exaggerate how much separate information you have.
Keep RSI, MACD, Stochastic, and trend strength distinct
The RSI guide explains a bounded oscillator based on smoothed upward and downward changes. RSI’s 70/30 reference levels belong to that calculation, not to an unbounded MOM line. Relative strength against a separate benchmark is another comparison again.
The MACD guide follows the difference between exponential moving averages and its signal line. MOM uses two endpoints directly. Their turning points and scales can differ; there is no universal rule that one must signal earlier in every market sequence.
The Stochastic Oscillator guide compares a close with its recent high-low range. ADX addresses trend strength rather than supplying MOM’s signed endpoint difference. Bollinger Bands describe a moving-average and dispersion framework. A broad “momentum” label does not make these calculations interchangeable.
Inspect divergence at matching price swings
A higher price high accompanied by a lower MOM high can describe bearish divergence. A lower price low accompanied by a higher MOM low can describe bullish divergence. Mark the actual observations used in both comparisons and keep Length, Source, and timeframe consistent.
If your price swings use wick extremes while MOM uses Close, state that choice. The oscillator does not directly calculate the distance between the wick high and its earlier counterpart. A visual disagreement can partly reflect which price field each comparison uses.
Divergence can persist through further price highs or lows. It supplies a condition for review, not the exact reversal time. Record examples where the expected price confirmation never happens. Avoid selecting oscillator peaks only after seeing which pair made a successful reversal look obvious.
Check gaps, data, and the developing bar
A one-bar move from a previous close of 100 to an opening and closing price of 110 produces MOM 1 = +10, even if that new bar barely trades away from its open. The calculation captures the gap between closes; it does not separate overnight repricing from movement within the latest bar.
Changing sessions, adjusted history, or the dated futures contract can change an endpoint. When reconciling two charts, record the exact symbol, contract convention, session, timeframe, Source, and timestamps. A generic description such as “Nasdaq momentum” is insufficient to establish matching inputs.
On the current bar, the latest Source can change before confirmation. A provisional zero crossing can disappear by the close. Keep confirmed-bar review separate from intrabar observations and use the actual information available at the time when evaluating alerts or entries.
Turn an observation into a complete risk rule
A hypothetical continuation study might require an upward price breakout and positive confirmed MOM. Define the breakout boundary, permitted entry time, stop location, cancellation rule, and exit before assessing it. MOM being positive is a filter in that example, not a complete instruction to buy.
Determine invalidation on the price chart. The difference between the current and earlier close is not automatically the distance to a protective stop. Use the position sizing guide to translate the selected price distance and instrument value per unit into a quantity fitting the risk budget.
Include fees, spreads, slippage, and failed signals. A historical close does not prove an order filled there. Compare average gains, average losses, drawdown, sample size, and later test data alongside win rate. More indicator lines do not remove those requirements.
Walk through a conditional continuation example
Return to the constructed sequence ending at 108 with MOM 3 = +8. Assume a separate price rule requires a completed close above resistance at 110. That condition has not occurred. The positive oscillator does not move the resistance or turn the current observation into an entry.
Extend the hypothetical sequence by one observation closing at 111.25. Its three-bar reference is observation 2’s close of 105, so MOM 3 is +6.25. A close above 110 and a positive MOM now coexist under this chosen rule. The oscillator is lower than the preceding +8, even though price has broken higher. Requiring MOM to rise as well would create a different filter and must be evaluated separately.
Suppose an execution model then assumes an entry at 111.50 and a protective stop at 108.00. The planned distance is 3.50 price units. A target two such distances above entry would be 118.50. These are hypothetical order assumptions; the chart sequence neither demonstrates a fill at 111.50 nor shows that the target is reached.
If price returns below the chosen invalidation, follow the defined exit rather than waiting for MOM to become negative. If the entry is missed, apply the cancellation rule rather than assigning a favorable fill afterward. Record the no-entry observation at 108, the later confirmation, the execution assumption, and any subsequent outcome as separate events.

Compare HDP discounts
Lucid 30% · Tradeify 30% · TPT 50%.
See current offers ↗Eligible partner plans only.
Momentum indicator FAQ
What is the Momentum indicator?
The built-in TradingView MOM study subtracts the Source value N bars earlier from the current Source. With Close selected, it shows a close-to-close price difference around zero. The broader term momentum indicators also includes other calculations such as RSI and MACD.
What is the MOM formula?
MOM(N) = current Source − Source N bars earlier. With a current close of 110 and an earlier close of 100, the difference is +10 price units. That value is not automatically a percentage.
What are TradingView’s default Momentum settings?
The built-in study uses Length 10, Source Close, and Timeframe Chart. Its Inputs panel also shows Wait for timeframe closes checked. Choose Momentum under Technicals to follow this study.
Why did MOM rise while price fell?
The reference endpoint also changes each bar. If the current close falls by one point while the reference falls by ten, MOM rises by nine. The worked example changes from −1 to +8 while the latest close falls from 109 to 108.
Does a zero crossing mean the latest candle rose?
No. A positive value means the current Source exceeds its newly selected N-bar reference. That can happen while the current close is lower than the immediately preceding close.
Why does another Momentum indicator use 100?
It may use a ratio rather than a difference. MetaTrader 5 calculates current close divided by the earlier close, multiplied by 100. Its unchanged-price baseline is 100; TradingView’s subtraction-based MOM has a zero baseline.
How is MOM different from percent ROC?
MOM is a price difference. Percent ROC divides that difference by the earlier price and multiplies by 100. For positive reference prices, their signs match, but their units and magnitudes differ.
Can I apply RSI’s 70 and 30 levels to MOM?
MOM has no fixed upper or lower boundary. A value such as +70 depends on the instrument’s price units and selected window. RSI’s reference levels belong to RSI’s bounded calculation.
Is Length 10 the best setting for day trading?
It is the default, not a verified optimum. Select a horizon appropriate to the question, then compare complete entry and exit rules across trending and ranging periods with costs and later test data.
How many prices does MOM 10 need?
It needs the current Source and the Source ten bars earlier. Including both endpoints requires eleven dated observations. Ten bars describe a comparison interval, not an inclusive set of ten values.
Does MOM divergence guarantee a reversal?
No. Price can keep extending while MOM fails to confirm successive swings. Define the price event needed for the method, retain failed cases, and set invalidation independently.
Does MOM measure volume or buying pressure?
The TradingView formula uses Source and Length only. It does not classify transactions, identify buyers, or accumulate volume. A positive reading describes the selected price difference.
Is a rising SMA independent confirmation of positive MOM?
For matching Source and Length, MOM(N) equals N times the one-bar change in SMA(N). Their signs therefore encode the same algebraic condition. That pairing alone does not provide two independent measurements.
Can the MOM value be used directly as a stop distance?
It measures the distance between two selected historical prices, not the setup’s invalidation. Choose the stop from the price rule, then calculate position size from that distance, instrument value, and available risk budget.